Smart Dashboards & Visual Insights

See your business clearly. We build interactive dashboards that turn messy data into simple, actionable stories for your team and professional projects.

What are Business Intelligence Dashboards?

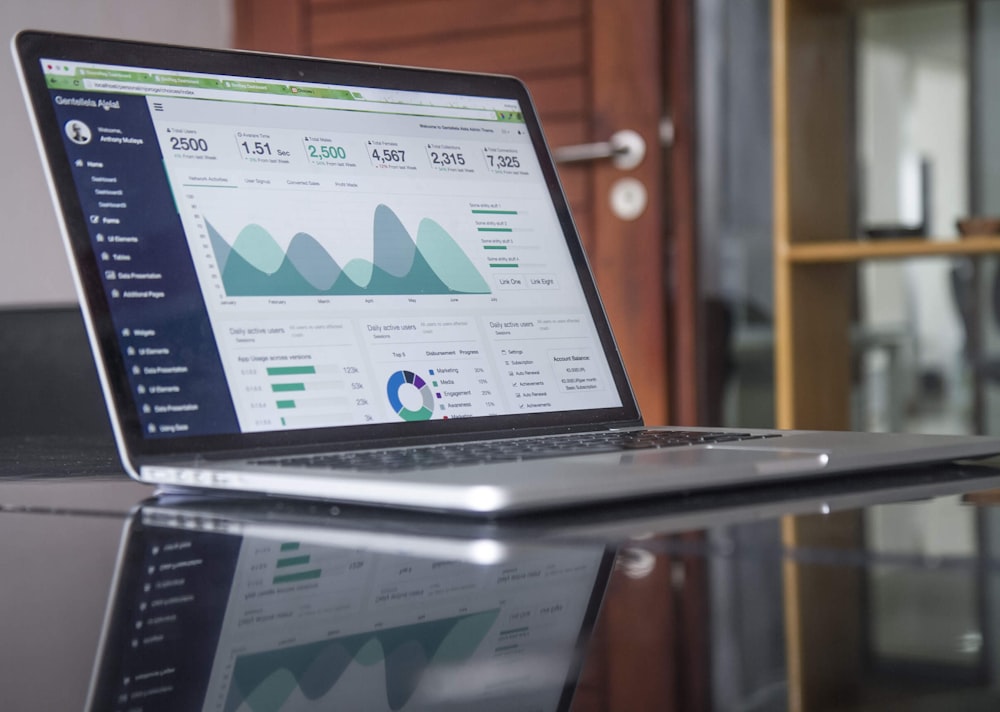
BI Dashboards turn fragmented company data into clear visual stories. These tools provide a central hub that helps your team monitor performance instantly across all departments.

At NexGenTech, we build customized data hubs that eliminate manual reporting. We transform complex numbers into simple charts, giving you total visibility to make professional, data-driven decisions fast.

The Business Challenge

Scattered data and slow manual reporting lead to decisions based on gut feeling. This causes your company to miss major growth opportunities and wastes hours of your time.

Our AI Solution

We centralize all your information into one automated place. You get smart dashboards that show your most important numbers in real-time without the admin work or technical debt.
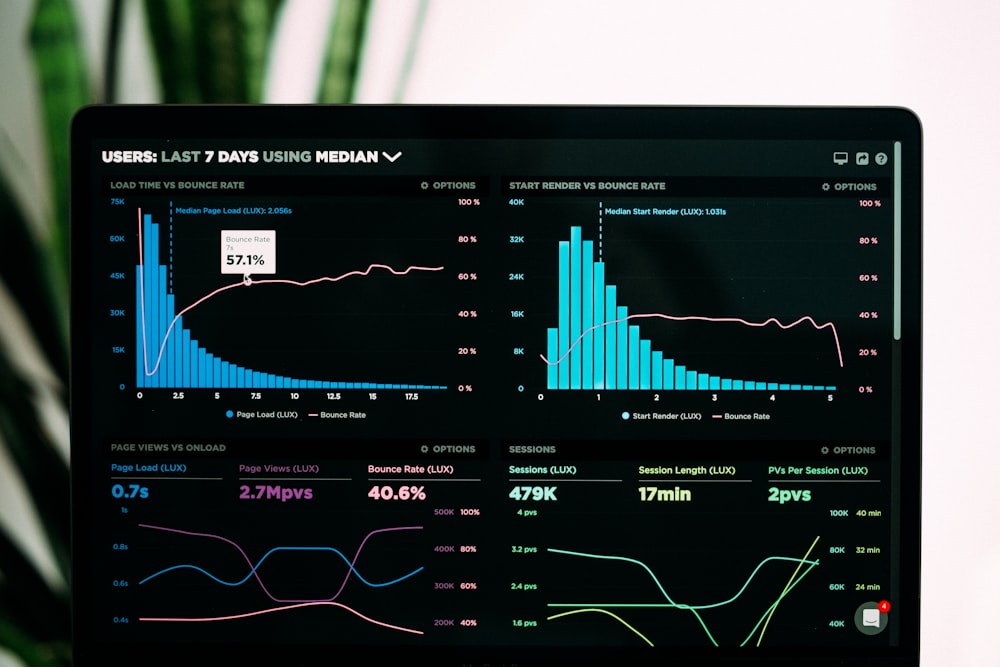
Business Intelligence Dashboard
Instant KPI Clarity

Data Storytelling Tools

Executive Dashboards

A high-level view of your entire company's performance and growth at a glance.

Team Performance Charts

Detailed reports for your Sales and Marketing teams to track daily wins and goals.

Smart KPI Alerts

Get instant notifications on Slack or Email the moment an important number hits its target, or needs attention.

Deep-Dive Data Discovery

Easy, clickable charts that let you look behind the high-level numbers to see exactly what's happening.

The BI Roadmap

We build a robust data foundation before crafting the perfect visualization layer.

1

Metric Choice

Finding the exact numbers that drive your business and identifying where they live.

2

Data Connection

Linking your apps and tools to one central system that gathers data automatically.

3

Dashboard Design

Building beautiful, easy-to-read charts that look great on any screen, from phone to desktop.

4

Launch & Training

Showing your team how to use their new tools to find insights on their own.

Proven Visualizations

Tableau Dashboard

Cross-Platform Hubs

Aggregating data from your key business platforms into a single "Source of Truth" dashboard.

Sales Performance

Sales Leaderboards

Real-time performance tracking for sales teams that drive motivation and competitive growth.

Finance Tracking

Financial Visibility

Monitoring Burn Rate, ARPU, and LTV automatically without the need for manual monthly exports.

Our Visualization Stack

Visual Engine
Unified Warehouse
Process Logic
Mobile Sync

Business Impact & ROI

Automatic Reports

Save days of manual work every month. No more copying and pasting numbers into spreadsheets.

Find Hidden Wins

Quickly see where you're making money, and where you're losing it, with instant trend tracking.

Team Empowerment

Give every department the power to answer their own questions with data they can actually understand.

Start Seeing the Full Picture

Ready to automate your reporting and get back to growing your business?

NexGenTech Logo

NexGen AI Assistant

Online
Hello! 👋 I'm the NexGen AI Assistant. How can I help you accelerate your digital transformation today?
⚠️ AI Assistant is under active development.